Showing posts with label graphs. Show all posts

'Tis The Season: Infograph


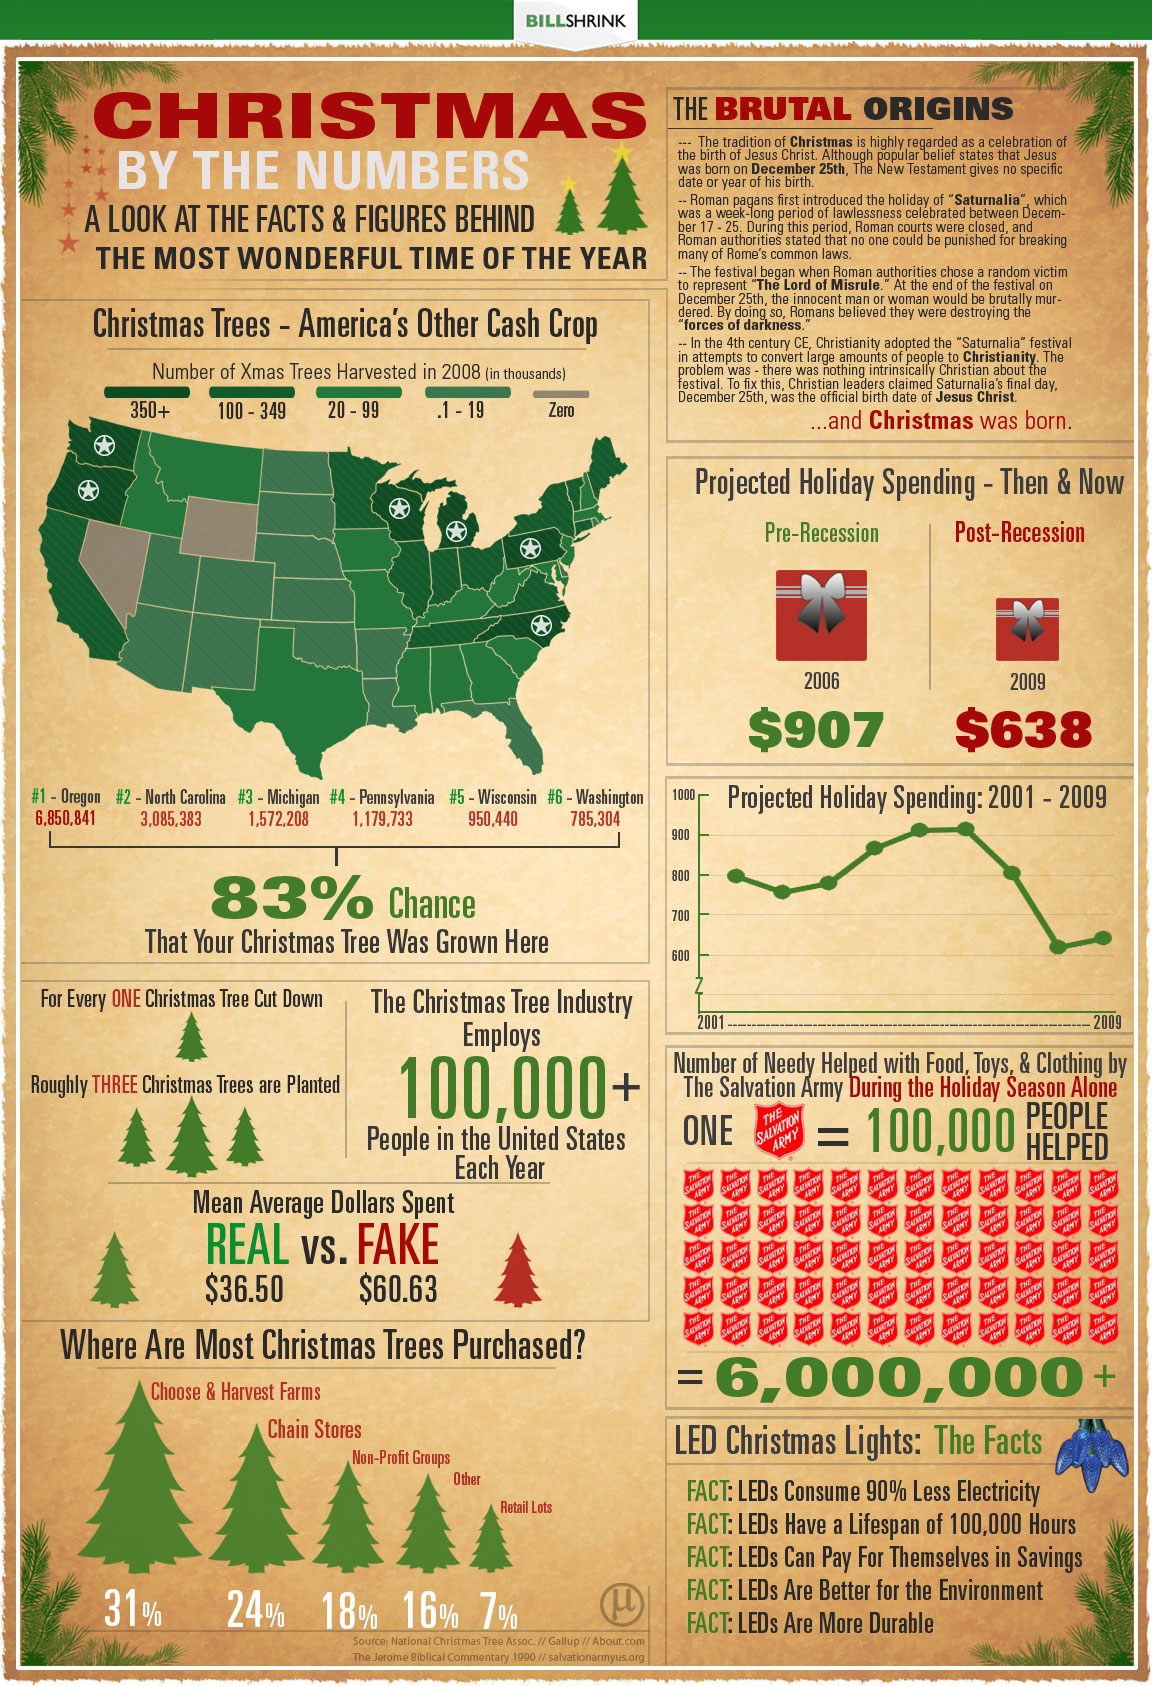
Here are some interesting facts and figures about our favorite time of year.

"‘Tis the season for Christmas trees, lights and gifts, and in the past that has also meant the season of outrageous spending. While the holidays may not be cheap, hard times sometimes call for desperate measures and drastic budget changes. Here’s a look at the hard facts and numbers of this most wonderful time of the year."

Click here to see this up close.

[via]

The Visual Miscellaneum Book


"Visual Miscellaneum" is the new eye-popping book of infographics by London-based visual and data journalist David McCandless. Forget about pie charts, bar graphs, line graphs and histograms; the book showcases the infinite number of ways to represent data through engaging graphics.

Those interested in getting a taste of David's work can follow his blog Information is Beautiful.

[via]
Related Posts Plugin for WordPress, Blogger...